GitDiagram
GitDiagram is a revolutionary visualization tool that helps developers understand complex Git workflows, track changes, and identify issues, making collaboration and debugging easier and more efficient.
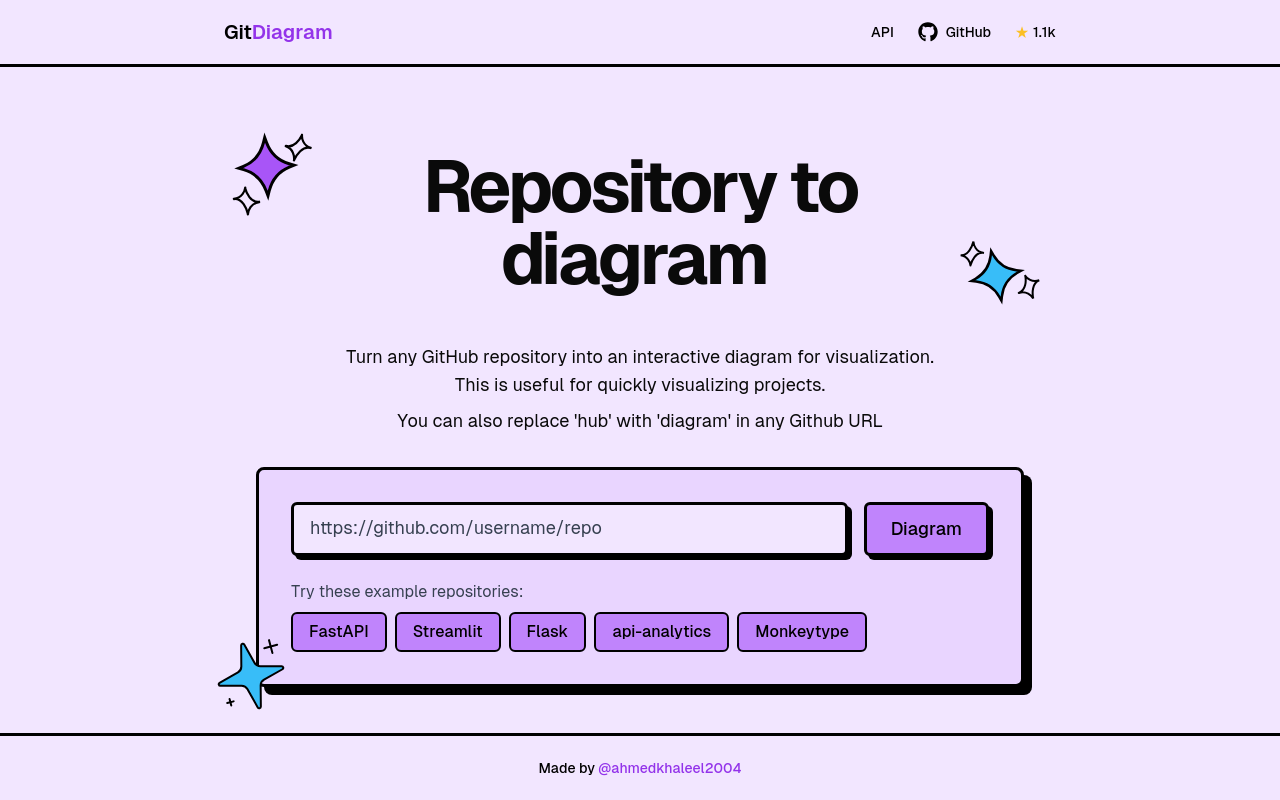
GitDiagram
Empowering Collaborative Git Workflow
GitDiagram is a cutting-edge, interactive visualization tool designed to simplify the complexities of Git workflows. By providing a clear and intuitive depiction of your project's history, branching, and merging, GitDiagram enables developers to effortlessly track changes, identify issues, and debug with precision.
Features
- Interactive Visualization: Visualize your Git workflow in real-time, with the ability to zoom in, zoom out, and navigate through commits with ease.
- Rich History: Uncover a detailed history of your project, including commits, branches, and merges, to quickly identify changes and resolve conflicts.
- Collaboration: Simplify collaboration by understanding how team members have contributed to the project, including changes, commits, and pull requests.
- Debugging: Identify and resolve issues quickly with GitDiagram's comprehensive repository of commit metadata, allowing for precise debugging and error-solving.
- Multi-Platform Support: Seamlessly integrate GitDiagram with your favorite IDE, GitHub, or GitLab for a unified development experience.
Benefits
- Enhanced Collaboration: Streamline teamwork by creating a shared understanding of your project's history, branching, and merging.
- Improved Debugging: Reduce debugging time by easily identifying and resolving issues with GitDiagram's interactive visualization.
- Increased Productivity: Focus on high-priority tasks by leveraging GitDiagram's automated tracking and issue resolution features.
Try GitDiagram Today
Experience the transformative power of GitDiagram for yourself. Sign up for a free trial or explore our pricing plans to discover how this game-changing tool can revolutionize your development workflow.