Chrome DevTools MCP
Chrome 공식 DevTools MCP 서버. AI 에이전트가 실제 브라우저를 구동, 검사, 디버깅합니다.
설치
전송 방식: stdio
claude mcp add chrome-devtools --scope user npx chrome-devtools-mcp@latest
도구 목록 (61)
click
Clicks on an element from the page snapshot.
drag
Drags an element onto another element.
fill
Types text into an input, text area, or selects an option.
fill_form
Fills out multiple form elements at once.
handle_dialog
Accepts or dismisses a browser dialog.
hover
Hovers over an element.
press_key
Presses a key or key combination.
type_text
Types text using the keyboard into a focused input.
upload_file
Uploads a file through a file input element.
click_at
Clicks at given coordinates (requires --experimentalVision).
close_page
Closes a page by its index.
list_pages
Lists all open pages including extension service workers.
navigate_page
Goes to a URL, or navigates back, forward, or reloads.
new_page
Opens a new tab and loads a URL.
select_page
Selects a page as context for future tool calls.
wait_for
Waits for specified text to appear on the selected page.
emulate
Emulates viewport, geolocation, color scheme, network conditions, and more.
resize_page
Resizes the page window to specified dimensions.
performance_analyze_insight
Gives detail on a specific performance insight from a trace.
performance_start_trace
Starts recording a performance trace.
performance_stop_trace
Stops the trace and returns performance insights.
get_network_request
Gets details of a single network request.
list_network_requests
Lists network requests made by the page.
evaluate_script
Evaluates JavaScript in the page and returns the result.
get_console_message
Gets a single console message by index.
get_css_styles
Gets the computed CSS styles of an element.
lighthouse_audit
Runs a Lighthouse audit on the page.
list_console_messages
Lists console messages (errors, warnings, logs).
screencast_start
Starts a screencast recording of the page.
screencast_stop
Stops the screencast recording.
set_logpoints
Sets logpoints (conditional console logging) in page scripts.
take_screenshot
Captures a screenshot of the page or a specific element.
take_snapshot
Gets the page accessibility tree with element UIDs.
take_heapsnapshot
Takes a JS heap snapshot for memory analysis.
analyze_heapsnapshot_contexts
Analyzes heap snapshot contexts.
close_heapsnapshot
Closes a heap snapshot session.
compare_heapsnapshots
Compares two heap snapshots to find growth.
get_heapsnapshot_class_nodes
Gets class nodes from a heap snapshot.
get_heapsnapshot_details
Gets details of a heap snapshot.
get_heapsnapshot_dominators
Gets dominator nodes from a heap snapshot.
get_heapsnapshot_duplicate_strings
Finds duplicate strings in a heap snapshot.
get_heapsnapshot_edges
Gets edges of a heap snapshot node.
get_heapsnapshot_object_details
Gets details of a heap object.
get_heapsnapshot_retainers
Gets retainers of a heap object.
get_heapsnapshot_retaining_paths
Gets retaining paths of a heap object.
get_heapsnapshot_summary
Gets a summary of a heap snapshot.
query_heapsnapshot_objects
Queries objects in a heap snapshot.
install_extension
Installs a Chrome extension.
list_extensions
Lists installed Chrome extensions.
reload_extension
Reloads a Chrome extension.
trigger_extension_action
Triggers an extension action (e.g. toolbar click).
uninstall_extension
Uninstalls a Chrome extension.
execute_3p_developer_tool
Executes a third-party developer tool.
list_3p_developer_tools
Lists available third-party developer tools.
execute_webmcp_tool
Executes a WebMCP tool exposed by the page.
list_webmcp_tools
Lists WebMCP tools exposed by the page.
get_os_app_state
Gets the install state of a PWA on the OS.
install_pwa
Installs a Progressive Web App.
launch_pwa
Launches an installed PWA.
uninstall_pwa
Uninstalls a PWA.
configure_webauthn
Configures a virtual WebAuthn authenticator.
가격
Free and open source (Apache 2.0). No account or API key needed.
Chrome DevTools MCP 리뷰: AI 에이전트에게 실제 브라우저를 운전하게 하기
웹 디버깅은 항상 사람이 브라우저를 들여다보는 작업이었습니다. 에이전트가 코드를 작성하고, 당신이 DevTools를 열고, 콘솔을 읽고, 네트워크 탭을 확인한 뒤, 본 것을 보고합니다. 에이전트는 웹 페이지의 진실이 있는 곳을 볼 수 없습니다.
Chrome DevTools MCP는 Chrome DevTools 팀의 공식 서버로, 에이전트에게 실제 Chrome 브라우저의 열쇠를 건네줍니다. 버전 1.12.0은 콘솔, 네트워크, 성능, 요소, 탐색을 다루는 61개의 도구를 제공하므로 에이전트는 페이지를 열고, 클릭하고, 콘솔 오류를 읽고, 네트워크 요청을 추적하고, 성능을 직접 측정할 수 있습니다. 에이전트가 라이브 웹 페이지를 검사하는 표준 방법입니다.
Chrome DevTools MCP란?
Chrome DevTools MCP는 Chrome DevTools 팀이 유지하는 Model Context Protocol 서버입니다. 로컬에서 실행되어 Chrome에 연결하며, 개발자가 DevTools 패널에서 사용하는 것과 같은 기능을 에이전트가 호출할 수 있는 도구로 공개합니다. 서버는 하나의 명령어로 실행할 수 있는 패키지로 배포되며 Claude Code, Cursor, VS Code, Claude Desktop의 표준 설정으로 동작합니다.
도구는 명확하게 나뉩니다. 탐색 도구는 페이지를 열고 기록을 이동합니다. 콘솔 도구는 로그 메시지와 오류를 읽습니다. 네트워크 도구는 요청, 응답, 헤더, 타이밍을 검사합니다. 성능 도구는 트레이스를 기록하고 로딩을 측정합니다. 요소 도구는 DOM을 검사하고 조작합니다. 에이전트는 스크린샷을 찍고, 기기를 에뮬레이션하고, 브라우저가 실제로 렌더링하는 대로 페이지를 읽을 수도 있습니다.
주요 기능
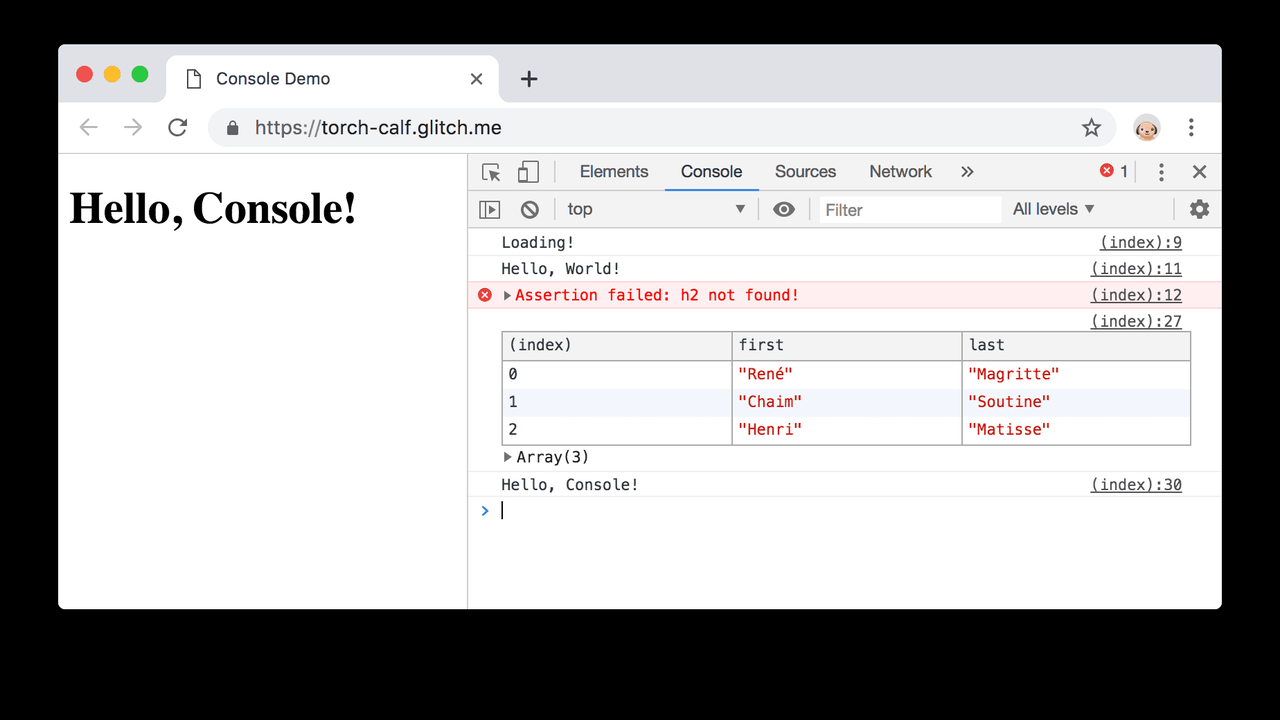
1. 개발자처럼 콘솔 읽기
에이전트는 브라우저에서 직접 콘솔 메시지, 경고, 오류를 읽습니다. 페이지가 고장 나면 정확한 오류, 스택, 줄 번호를 보며 DevTools에서 복사해 달라고 할 필요가 없습니다.
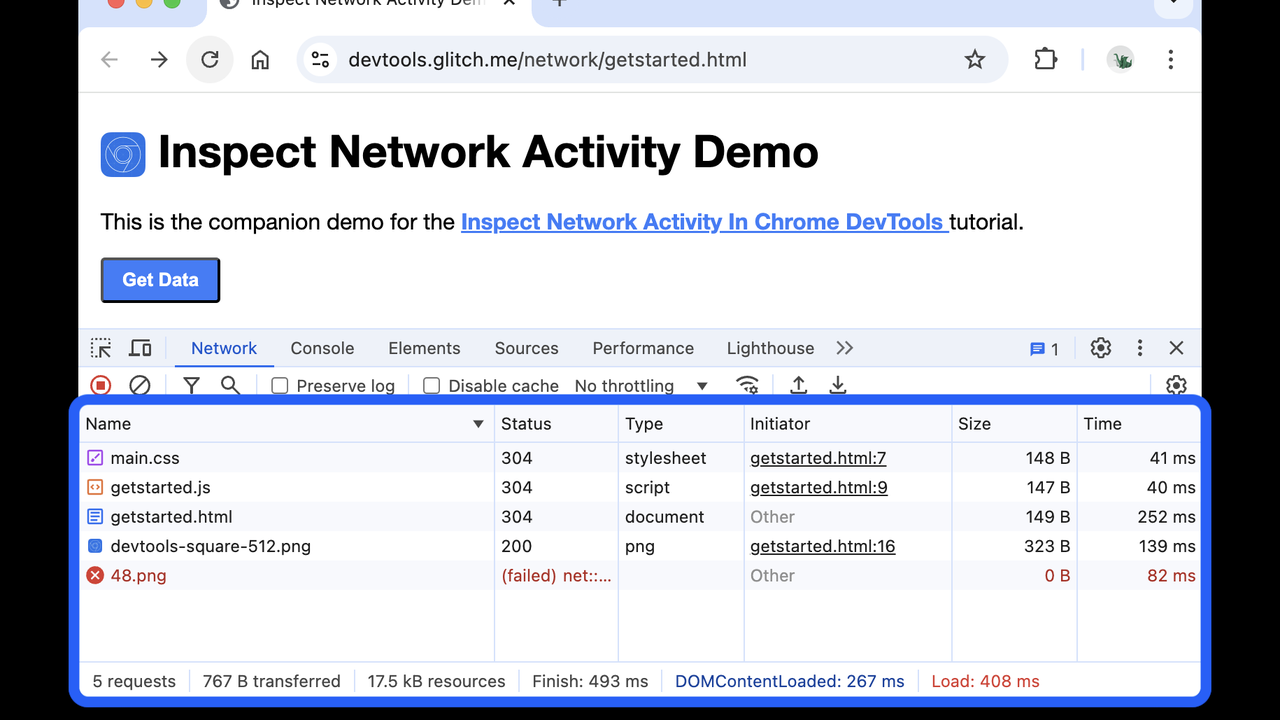
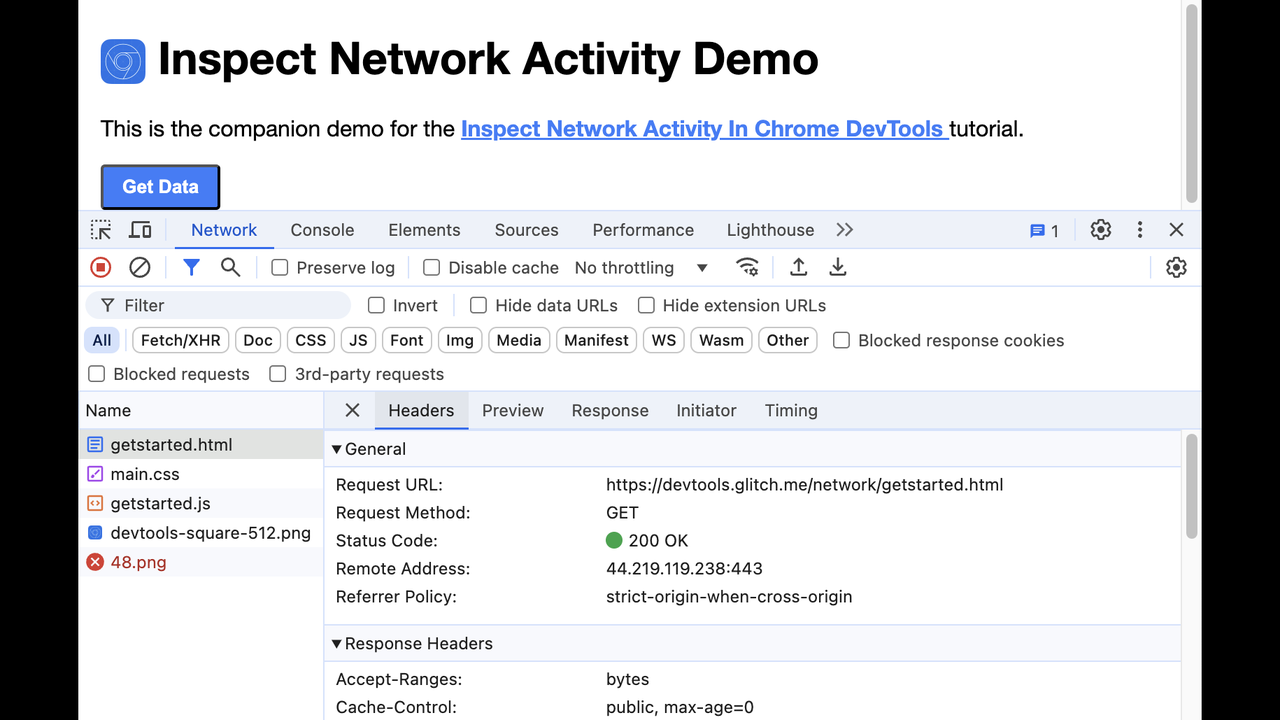
2. 완전한 네트워크 검사
모든 요청이 보입니다. URL, 메서드, 헤더, 상태, 타이밍, 본문입니다. 에이전트는 네트워크 탭을 열지 않고도 실패한 API 호출, 느린 애셋, 누락된 헤더를 찾을 수 있습니다.
3. 에이전트 스스로 측정하는 성능 트레이스
성능 도구는 트레이스를 기록하고 로딩 시간, 긴 작업, 레이아웃 이동을 보고합니다. 에이전트는 페이지가 빨라졌는지 추측하는 대신 수정을 측정할 수 있습니다.
4. 읽기만 하는 것이 아니라 페이지 운전하기
클릭, 입력, 스크롤, 탐색입니다. 에이전트는 단계를 직접 수행해 버그를 재현하고, 수정 후 같은 흐름을 다시 실행해 확인할 수 있습니다.
5. 스크린샷과 실제 렌더링된 DOM
스크린샷과 DOM 스냅샷은 레이아웃과 스타일을 포함해 브라우저가 렌더링하는 그대로의 페이지를 보여줍니다. 에이전트는 코드가 옳다고 가정하는 대신 자신의 프론트엔드 작업을 눈으로 확인할 수 있습니다.
작동 방식
하나의 명령어로 서버를 클라이언트에 추가한 뒤 원격 디버깅을 활성화한 Chrome을 시작하거나 서버가 시작하게 합니다. 에이전트가 연결되면 61개의 도구가 나타납니다. 페이지를 열고 고장 난 흐름을 따라가게 하고 발견한 것을 보고하게 하세요. 수정을 제안하면 페이지를 다시 로드해 오류가 사라졌는지 확인할 수 있습니다.
서버는 로컬에서 실행되어 자신의 Chrome에 연결하므로 계정도 키도 호스팅 서비스도 관여하지 않습니다. 브라우징은 자신의 컴퓨터에 머뭅니다.
누가 사용하면 좋을까
AI 어시스턴트와 함께 프론트엔드를 디버깅하는 개발자, 에이전트에게 자신의 웹 작업을 검증하게 하고 싶은 팀, 오늘도 웹 페이지를 손으로 테스트하는 사람입니다. 콘솔 오류를 채팅에 붙여넣은 적이 있다면, 그것을 불필요하게 만드는 도구가 이것입니다.
가격
무료 오픈소스(Apache 2.0)입니다. 계정이나 API 키가 필요 없습니다.
장점과 단점
장점
- 공식 서버: 브라우저 전체를 다루는 61개의 도구
- 에이전트는 요약이 아니라 실제 콘솔, 네트워크, 성능 데이터를 봄
- 무료, 오픈소스, 로컬: 계정도 키도 호스팅 서비스도 필요 없음
- 페이지를 운전하고 흐름을 다시 실행해 수정을 검증할 수 있음
단점
- 로컬 전용: 자신의 컴퓨터에 있는 브라우저를 운전하며 원격이나 호스팅 브라우저가 아님
- 에이전트가 클릭하고 입력할 수 있어 방문한 페이지의 상태를 바꿀 수 있음. 신뢰할 수 있는 페이지에서 사용할 것
- 61개의 도구는 많아 올바른 도구를 고르려면 좋은 프롬프트가 필요함
최종 평가
AI 에이전트가 프론트엔드를 작성한다면 개발자와 같은 방식으로 그 프론트엔드를 볼 수 있어야 합니다. 이것이 공식적이고 무료이며 로컬인 방법입니다. 설치하고 작업 중인 페이지를 가리킨 뒤, 콘솔 오류를 채팅에 복사하는 사람이 되는 일을 그만두세요.