Chrome DevTools MCP
Chrome's official DevTools MCP server: let AI agents drive, inspect and debug a real browser.
Install
Transport: stdio
claude mcp add chrome-devtools --scope user npx chrome-devtools-mcp@latest
Tools (61)
click
Clicks on an element from the page snapshot.
drag
Drags an element onto another element.
fill
Types text into an input, text area, or selects an option.
fill_form
Fills out multiple form elements at once.
handle_dialog
Accepts or dismisses a browser dialog.
hover
Hovers over an element.
press_key
Presses a key or key combination.
type_text
Types text using the keyboard into a focused input.
upload_file
Uploads a file through a file input element.
click_at
Clicks at given coordinates (requires --experimentalVision).
close_page
Closes a page by its index.
list_pages
Lists all open pages including extension service workers.
navigate_page
Goes to a URL, or navigates back, forward, or reloads.
new_page
Opens a new tab and loads a URL.
select_page
Selects a page as context for future tool calls.
wait_for
Waits for specified text to appear on the selected page.
emulate
Emulates viewport, geolocation, color scheme, network conditions, and more.
resize_page
Resizes the page window to specified dimensions.
performance_analyze_insight
Gives detail on a specific performance insight from a trace.
performance_start_trace
Starts recording a performance trace.
performance_stop_trace
Stops the trace and returns performance insights.
get_network_request
Gets details of a single network request.
list_network_requests
Lists network requests made by the page.
evaluate_script
Evaluates JavaScript in the page and returns the result.
get_console_message
Gets a single console message by index.
get_css_styles
Gets the computed CSS styles of an element.
lighthouse_audit
Runs a Lighthouse audit on the page.
list_console_messages
Lists console messages (errors, warnings, logs).
screencast_start
Starts a screencast recording of the page.
screencast_stop
Stops the screencast recording.
set_logpoints
Sets logpoints (conditional console logging) in page scripts.
take_screenshot
Captures a screenshot of the page or a specific element.
take_snapshot
Gets the page accessibility tree with element UIDs.
take_heapsnapshot
Takes a JS heap snapshot for memory analysis.
analyze_heapsnapshot_contexts
Analyzes heap snapshot contexts.
close_heapsnapshot
Closes a heap snapshot session.
compare_heapsnapshots
Compares two heap snapshots to find growth.
get_heapsnapshot_class_nodes
Gets class nodes from a heap snapshot.
get_heapsnapshot_details
Gets details of a heap snapshot.
get_heapsnapshot_dominators
Gets dominator nodes from a heap snapshot.
get_heapsnapshot_duplicate_strings
Finds duplicate strings in a heap snapshot.
get_heapsnapshot_edges
Gets edges of a heap snapshot node.
get_heapsnapshot_object_details
Gets details of a heap object.
get_heapsnapshot_retainers
Gets retainers of a heap object.
get_heapsnapshot_retaining_paths
Gets retaining paths of a heap object.
get_heapsnapshot_summary
Gets a summary of a heap snapshot.
query_heapsnapshot_objects
Queries objects in a heap snapshot.
install_extension
Installs a Chrome extension.
list_extensions
Lists installed Chrome extensions.
reload_extension
Reloads a Chrome extension.
trigger_extension_action
Triggers an extension action (e.g. toolbar click).
uninstall_extension
Uninstalls a Chrome extension.
execute_3p_developer_tool
Executes a third-party developer tool.
list_3p_developer_tools
Lists available third-party developer tools.
execute_webmcp_tool
Executes a WebMCP tool exposed by the page.
list_webmcp_tools
Lists WebMCP tools exposed by the page.
get_os_app_state
Gets the install state of a PWA on the OS.
install_pwa
Installs a Progressive Web App.
launch_pwa
Launches an installed PWA.
uninstall_pwa
Uninstalls a PWA.
configure_webauthn
Configures a virtual WebAuthn authenticator.
Quality and security
Pricing
Free and open source (Apache 2.0). No account or API key needed.
Chrome DevTools MCP Review: Let Your AI Agent Drive a Real Browser
Web debugging has always been a human looking at a browser. The agent writes the code, you open DevTools, you read the console, you check the network tab, and you report back what you saw. The agent is blind to the one place where the truth about a web page actually lives.
Chrome DevTools MCP is the official server from the Chrome DevTools team, and it hands the agent the keys to a real Chrome browser. Version 1.12.0 ships 61 tools covering the console, network, performance, elements, and navigation, so the agent can open a page, click through it, read console errors, trace network requests, and measure performance itself. It is the standard way for an agent to inspect a live web page.
What is Chrome DevTools MCP?
Chrome DevTools MCP is a Model Context Protocol server maintained by the Chrome DevTools team. It runs locally and connects to Chrome, exposing the same capabilities a developer uses in the DevTools panels as tools an agent can call. The server is distributed as a package you run with one command, and it works with Claude Code, Cursor, VS Code, and Claude Desktop through the standard configuration.
The tools fall into clear groups. Navigation tools open pages and move through history. Console tools read log messages and errors. Network tools inspect requests, responses, headers, and timing. Performance tools record traces and measure load. Element tools inspect and interact with the DOM. The agent can also take screenshots, emulate devices, and read the page as the browser actually renders it.
Key Features
1. Read the console like a developer
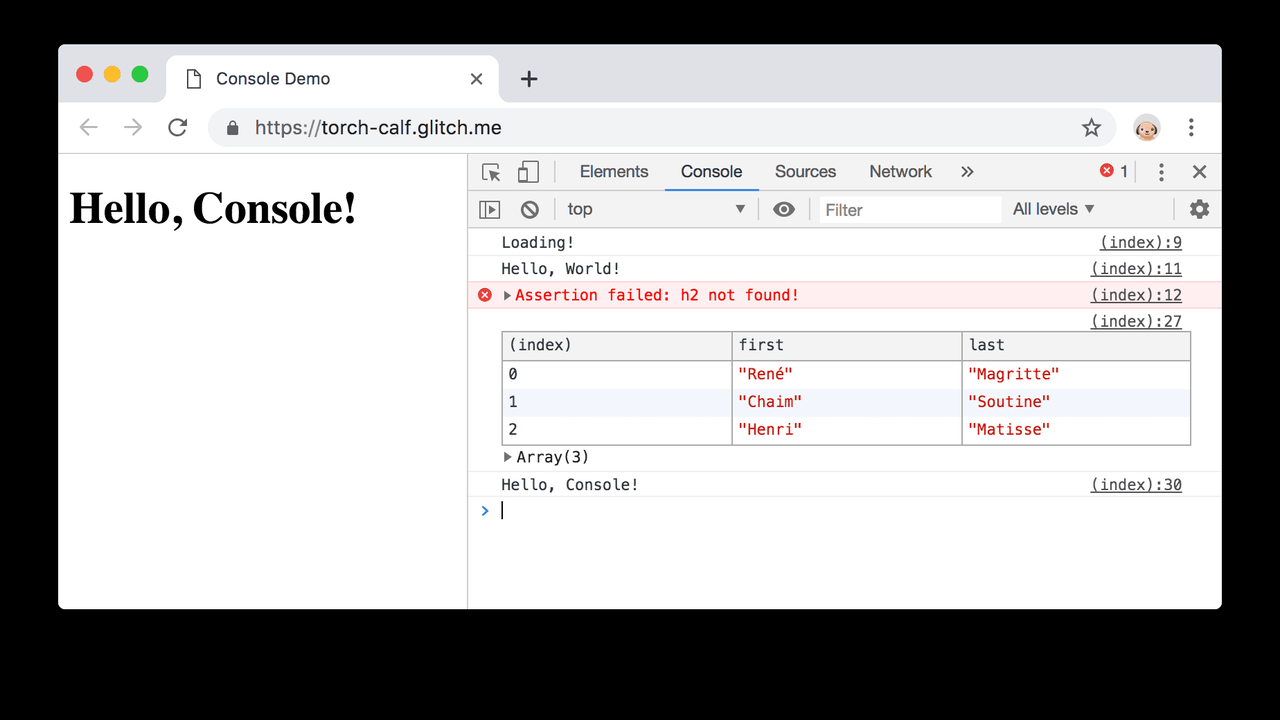
The agent reads console messages, warnings, and errors directly from the browser. When a page breaks, it sees the exact error, the stack, and the line, instead of asking you to copy it out of DevTools.
2. Full network inspection
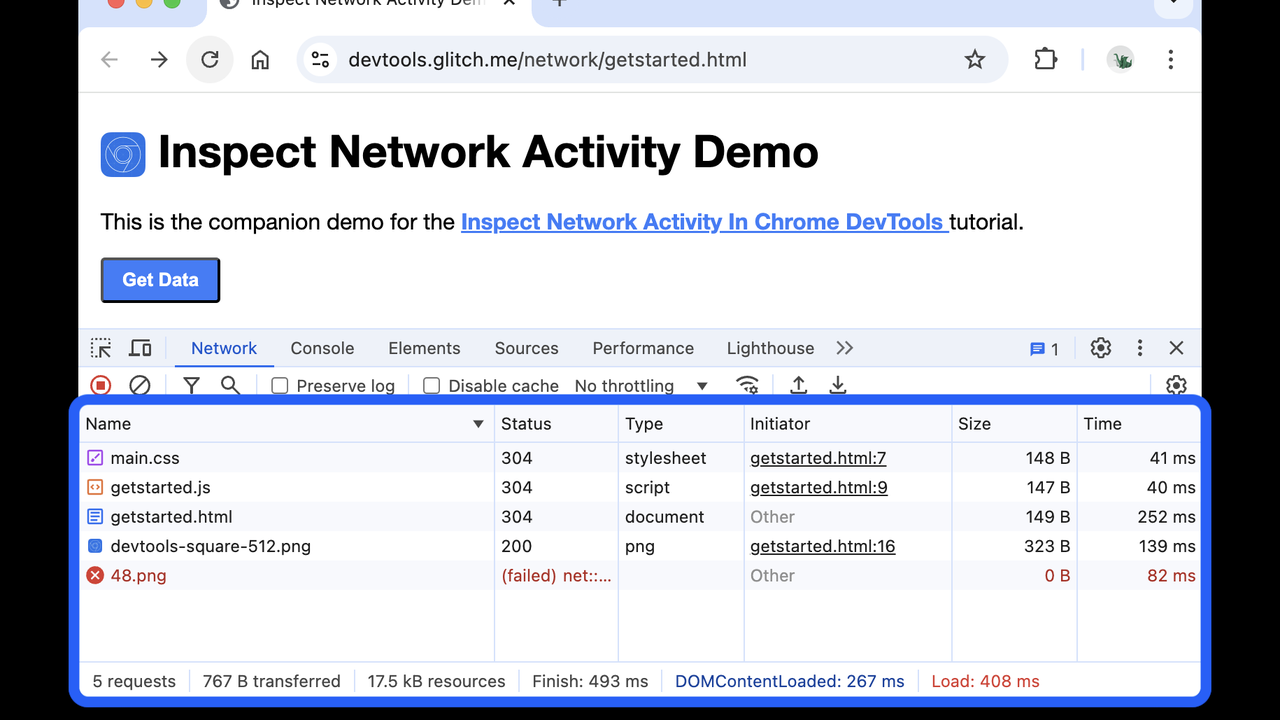
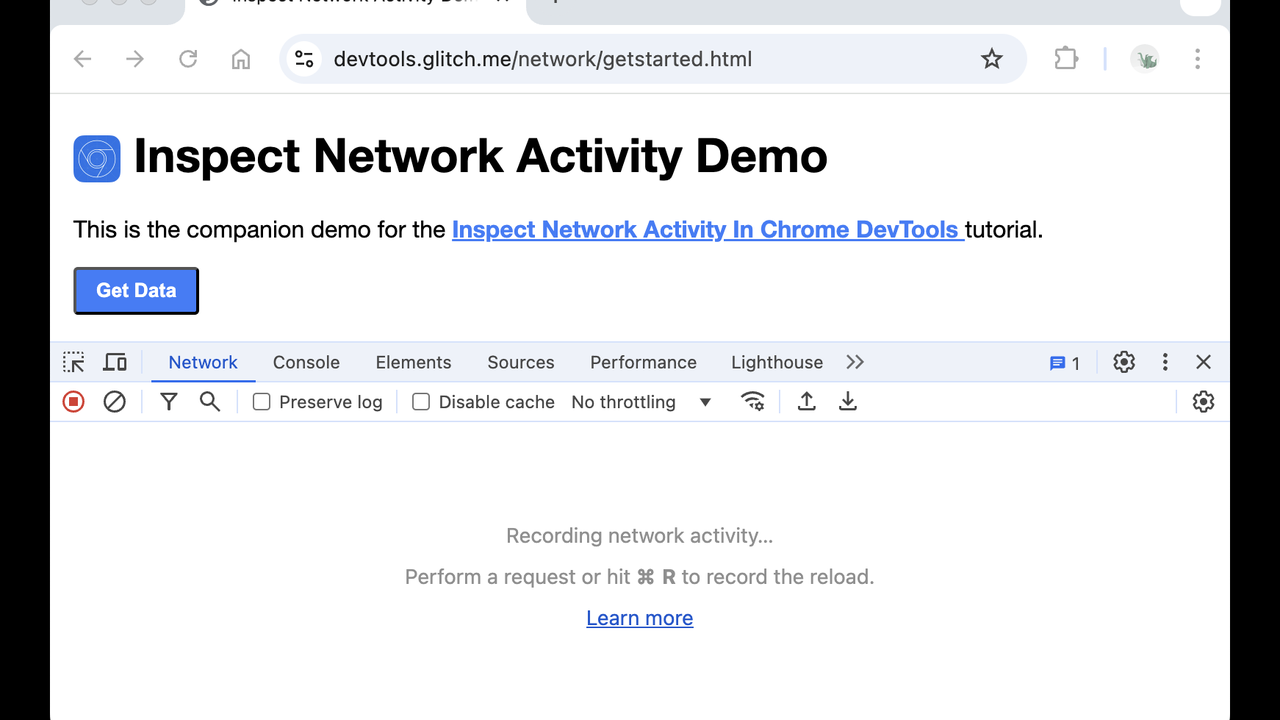
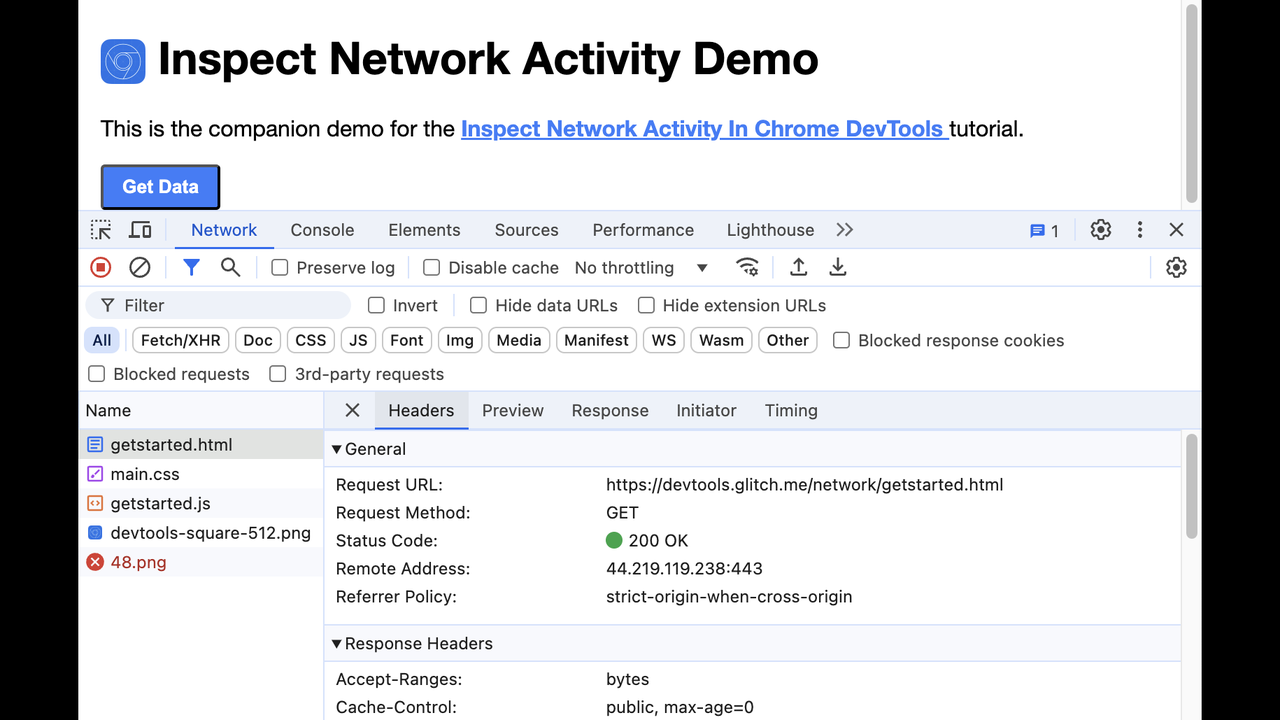
Every request is visible: URL, method, headers, status, timing, and body. The agent can find the failing API call, the slow asset, or the missing header without you opening the network tab.
3. Performance traces the agent can measure
Performance tools record traces and report load timing, long tasks, and layout shifts. The agent can measure a fix instead of guessing whether the page got faster.
4. Drive the page, not just read it
Click, type, scroll, and navigate. The agent can reproduce a bug by performing the steps itself, then verify the fix by running through the same flow again.
5. Screenshots and the real rendered DOM
Screenshots and DOM snapshots show the page as the browser renders it, including layout and styling. The agent checks its own frontend work visually instead of assuming the code is right.
How It Works
Add the server to your client with one command, then start Chrome with remote debugging enabled, or let the server launch it. The agent connects and the 61 tools appear. Ask it to open your page, click through the flow that is broken, and report what it finds. When it proposes a fix, it can reload the page and confirm the error is gone.
Because the server runs locally and talks to your own Chrome, there is no account, no key, and no hosted service involved. Your browsing stays on your machine.
Who Should Use Chrome DevTools MCP?
Frontend developers who debug with an AI assistant, teams that want the agent to verify its own web work, and anyone who tests web pages by hand today. If you have ever pasted a console error into a chat, this is the tool that stops that from being necessary.
Chrome DevTools MCP Pricing
Free and open source (Apache 2.0). No account or API key needed.
Chrome DevTools MCP Pros and Cons
Pros
- Official Chrome DevTools server: 61 tools covering the whole browser
- The agent sees the real console, network, and performance data, not a summary
- Free, open source, local: no account, no key, no hosted service
- Can drive the page and verify fixes by re-running the flow
Cons
- Local only: it drives the browser on your machine, not a remote or hosted browser
- The agent can click and type, so it can change state on pages it visits; use it on pages you trust
- 61 tools is a lot to learn; the agent needs good prompting to pick the right one
Final Verdict
If an AI agent writes your frontend, it should be able to see that frontend the way a developer does. This is the official, free, local way to give it that sight. Install it, point it at the page you are working on, and stop being the person who copies console errors into the chat.