Chrome DevTools MCP
Chrome 官方 DevTools MCP 服务器:让 AI Agent 操控、检查与调试真实浏览器。
安装
传输方式: stdio
claude mcp add chrome-devtools --scope user npx chrome-devtools-mcp@latest
工具列表 (61)
click
Clicks on an element from the page snapshot.
drag
Drags an element onto another element.
fill
Types text into an input, text area, or selects an option.
fill_form
Fills out multiple form elements at once.
handle_dialog
Accepts or dismisses a browser dialog.
hover
Hovers over an element.
press_key
Presses a key or key combination.
type_text
Types text using the keyboard into a focused input.
upload_file
Uploads a file through a file input element.
click_at
Clicks at given coordinates (requires --experimentalVision).
close_page
Closes a page by its index.
list_pages
Lists all open pages including extension service workers.
navigate_page
Goes to a URL, or navigates back, forward, or reloads.
new_page
Opens a new tab and loads a URL.
select_page
Selects a page as context for future tool calls.
wait_for
Waits for specified text to appear on the selected page.
emulate
Emulates viewport, geolocation, color scheme, network conditions, and more.
resize_page
Resizes the page window to specified dimensions.
performance_analyze_insight
Gives detail on a specific performance insight from a trace.
performance_start_trace
Starts recording a performance trace.
performance_stop_trace
Stops the trace and returns performance insights.
get_network_request
Gets details of a single network request.
list_network_requests
Lists network requests made by the page.
evaluate_script
Evaluates JavaScript in the page and returns the result.
get_console_message
Gets a single console message by index.
get_css_styles
Gets the computed CSS styles of an element.
lighthouse_audit
Runs a Lighthouse audit on the page.
list_console_messages
Lists console messages (errors, warnings, logs).
screencast_start
Starts a screencast recording of the page.
screencast_stop
Stops the screencast recording.
set_logpoints
Sets logpoints (conditional console logging) in page scripts.
take_screenshot
Captures a screenshot of the page or a specific element.
take_snapshot
Gets the page accessibility tree with element UIDs.
take_heapsnapshot
Takes a JS heap snapshot for memory analysis.
analyze_heapsnapshot_contexts
Analyzes heap snapshot contexts.
close_heapsnapshot
Closes a heap snapshot session.
compare_heapsnapshots
Compares two heap snapshots to find growth.
get_heapsnapshot_class_nodes
Gets class nodes from a heap snapshot.
get_heapsnapshot_details
Gets details of a heap snapshot.
get_heapsnapshot_dominators
Gets dominator nodes from a heap snapshot.
get_heapsnapshot_duplicate_strings
Finds duplicate strings in a heap snapshot.
get_heapsnapshot_edges
Gets edges of a heap snapshot node.
get_heapsnapshot_object_details
Gets details of a heap object.
get_heapsnapshot_retainers
Gets retainers of a heap object.
get_heapsnapshot_retaining_paths
Gets retaining paths of a heap object.
get_heapsnapshot_summary
Gets a summary of a heap snapshot.
query_heapsnapshot_objects
Queries objects in a heap snapshot.
install_extension
Installs a Chrome extension.
list_extensions
Lists installed Chrome extensions.
reload_extension
Reloads a Chrome extension.
trigger_extension_action
Triggers an extension action (e.g. toolbar click).
uninstall_extension
Uninstalls a Chrome extension.
execute_3p_developer_tool
Executes a third-party developer tool.
list_3p_developer_tools
Lists available third-party developer tools.
execute_webmcp_tool
Executes a WebMCP tool exposed by the page.
list_webmcp_tools
Lists WebMCP tools exposed by the page.
get_os_app_state
Gets the install state of a PWA on the OS.
install_pwa
Installs a Progressive Web App.
launch_pwa
Launches an installed PWA.
uninstall_pwa
Uninstalls a PWA.
configure_webauthn
Configures a virtual WebAuthn authenticator.
价格
Free and open source (Apache 2.0). No account or API key needed.
Chrome DevTools MCP 评测:让 AI Agent 亲自开一个真实浏览器
网页调试一直是人盯着浏览器在做。Agent 写代码,你打开 DevTools,你读控制台,你看网络面板,再回头告诉它你看到了什么。Agent 对网页真相所在的地方是看不见的。
Chrome DevTools MCP 是 Chrome DevTools 团队的官方服务器,它把一个真实 Chrome 浏览器的钥匙交给了 Agent。1.12.0 版提供 61 个工具,覆盖控制台、网络、性能、元素和导航,Agent 可以打开页面、点一点、读控制台报错、追踪网络请求、测量性能。这是 Agent 检查线上网页的标准做法。
什么是 Chrome DevTools MCP?
Chrome DevTools MCP 是由 Chrome DevTools 团队维护的 Model Context Protocol 服务器。它在本地运行并连接 Chrome,把开发者在 DevTools 面板里用的能力变成 Agent 可以调用的工具。服务器以一个包的形式分发,一条命令就能跑起来,支持 Claude Code、Cursor、VS Code 和 Claude Desktop 的标准配置。
工具分工明确。导航工具打开页面、移动历史记录。控制台工具读取日志和报错。网络工具检查请求、响应、请求头和耗时。性能工具记录追踪并测量加载。元素工具检查和操作 DOM。Agent 还能截图、模拟设备、按浏览器实际渲染的样子读取页面。
核心功能
1. 像开发者一样读控制台
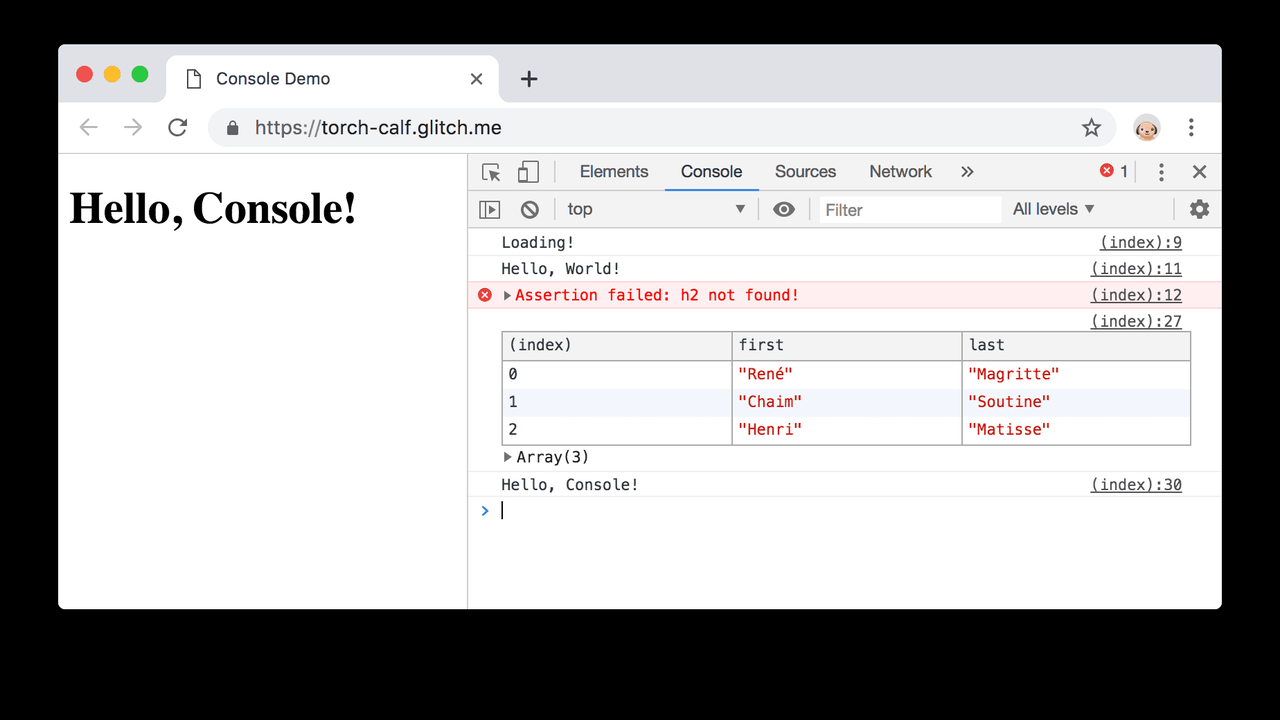
Agent 直接从浏览器读取控制台消息、警告和报错。页面出问题时,它看到的是确切的报错、堆栈和行号,而不是让你从 DevTools 里复制出来。
2. 完整的网络检查
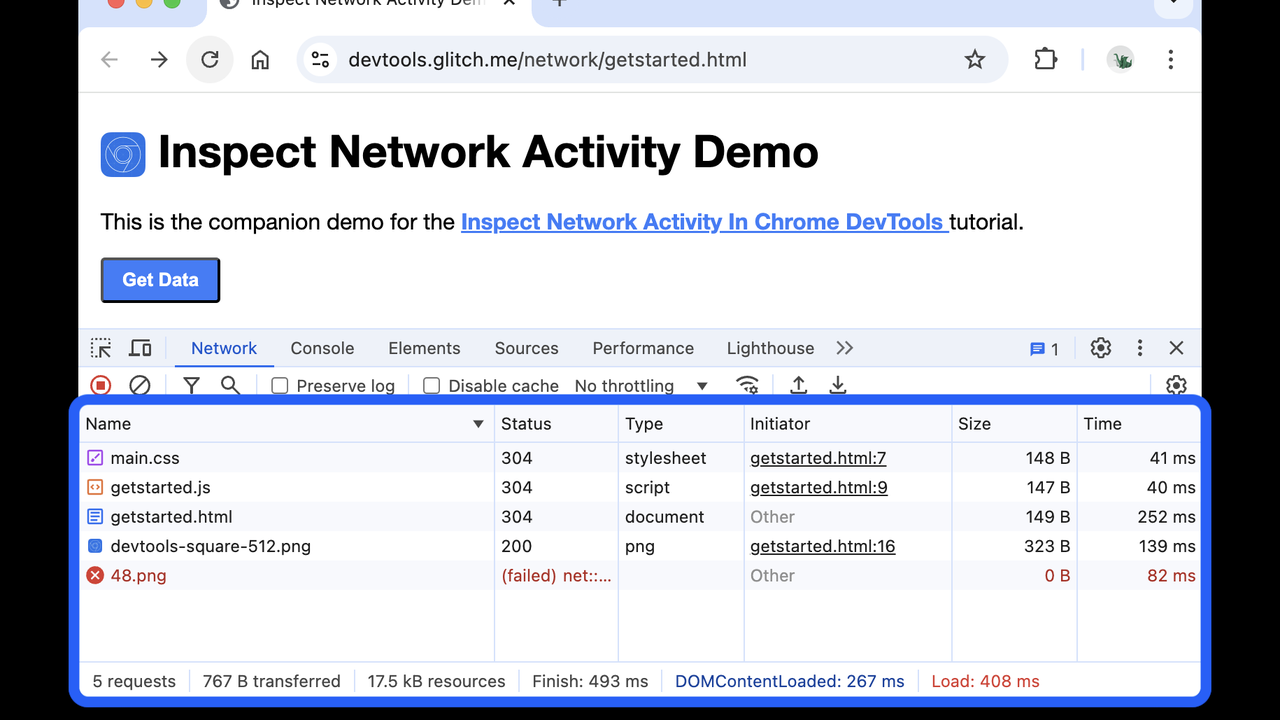
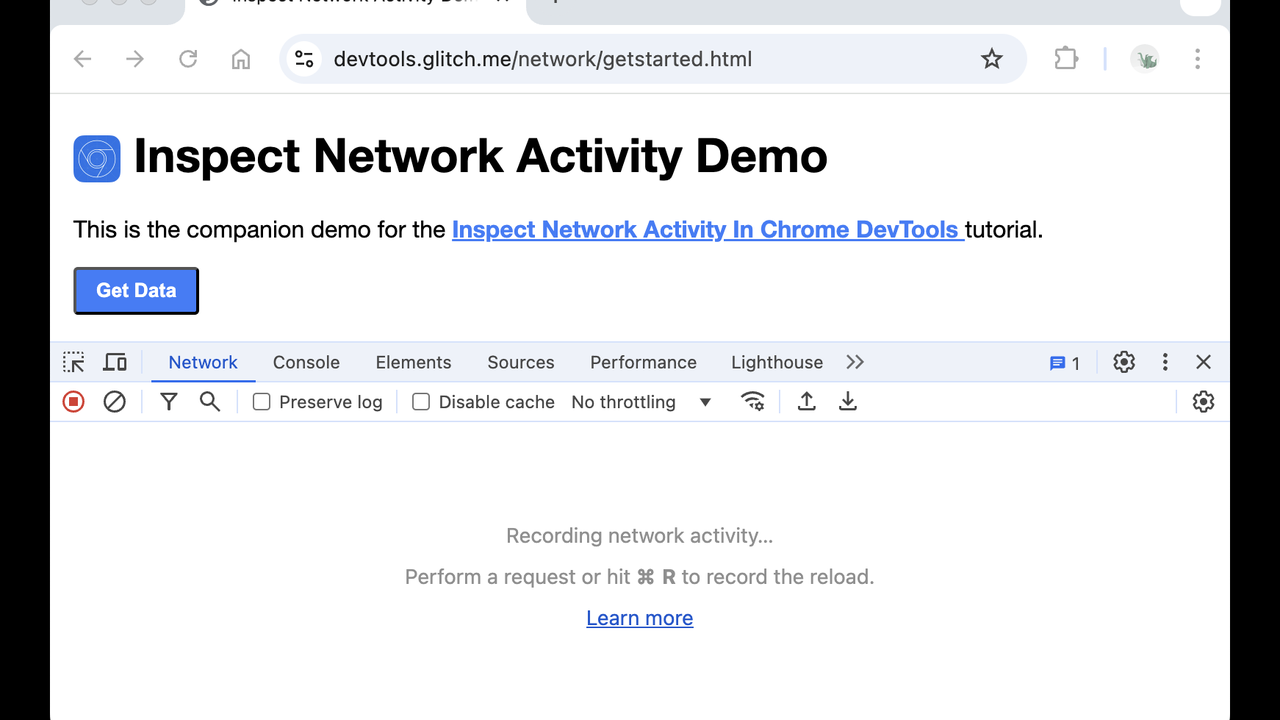
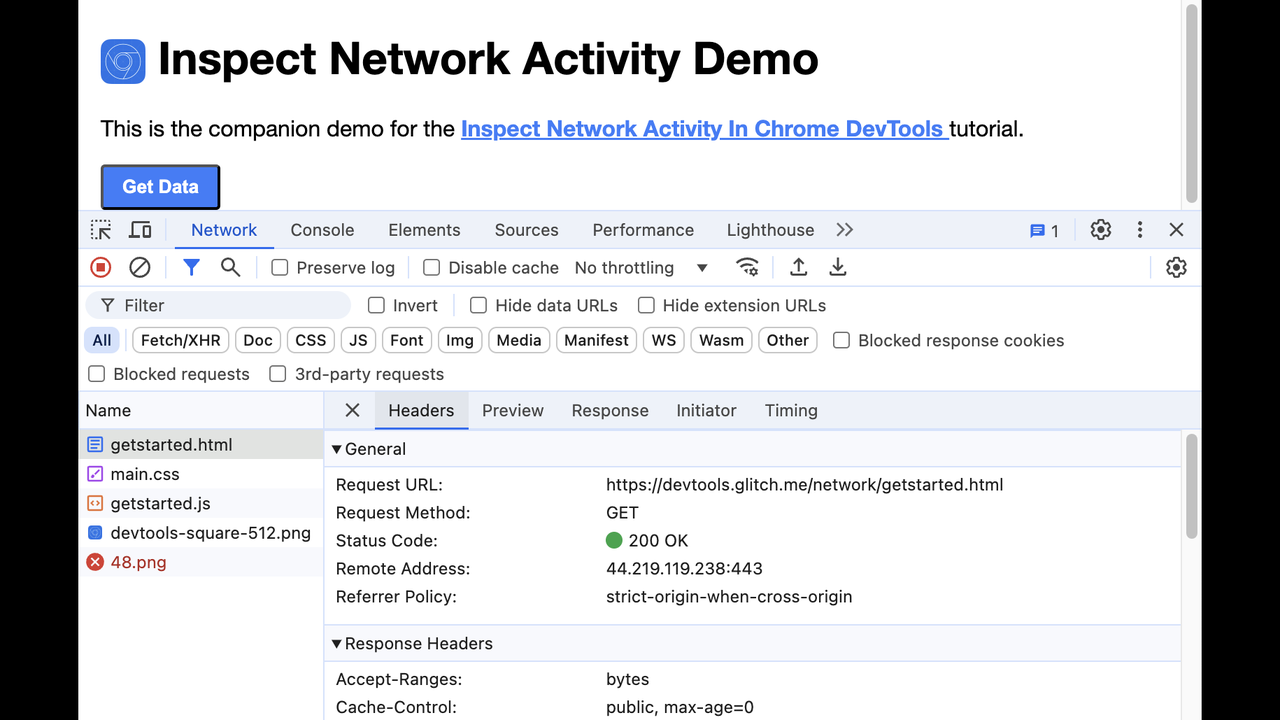
每个请求都看得见:URL、方法、请求头、状态、耗时和正文。Agent 能找到失败的 API 调用、慢的资源或缺失的请求头,不用你打开网络面板。
3. Agent 自己能测量的性能追踪
性能工具记录追踪并报告加载时间、长任务和布局偏移。Agent 可以测量修复效果,而不是猜页面是不是变快了。
4. 不只是读,还能操作页面
点击、输入、滚动、导航。Agent 可以自己执行步骤来复现 bug,修复后再走一遍同样的流程验证。
5. 截图与真实渲染的 DOM
截图和 DOM 快照展示浏览器实际渲染的页面,包括布局和样式。Agent 可以直观地检查自己的前端工作,而不是假设代码是对的。
工作原理
一条命令把服务器加到客户端,然后用远程调试开启 Chrome,或者让服务器自己启动它。Agent 连上后 61 个工具就出现了。让它打开你的页面,走一遍出问题的流程,报告发现。提出修复后,它可以重新加载页面并确认报错消失了。
因为服务器在本地运行、连接的是你自己的 Chrome,不涉及账号、密钥或托管服务。你的浏览记录留在你自己的机器上。
适合谁用?
和 AI 助手一起调试前端的开发者、想让 Agent 验证自己网页工作的团队,以及今天还在手动测试网页的人。如果你曾经把控制台报错粘贴到聊天里,这就是让你不用再这么做的工具。
价格
免费开源(Apache 2.0)。不需要账号或 API 密钥。
优点与缺点
优点
- 官方服务器:61 个工具覆盖整个浏览器
- Agent 看到的是真实的控制台、网络和性能数据,不是摘要
- 免费、开源、本地:没有账号、密钥或托管服务
- 可以操作页面并通过重跑流程验证修复
缺点
- 仅限本地:驱动的是你机器上的浏览器,不是远程或托管浏览器
- Agent 可以点击和输入,会改变访问页面的状态,只在信任的页面上用
- 61 个工具很多,Agent 需要好的提示才能选对工具
上手提示
先让 Agent 打开你正在开发的页面,走一遍出问题的流程。让它自己读控制台报错、看网络请求,再提出修复。修复后让它重新加载页面验证,确认报错消失。养成这个习惯后,你就不用再手动复制控制台报错了。性能问题也一样,让 Agent 自己录追踪、报数据,比凭感觉调要靠谱得多。
最终评价
如果 AI Agent 写你的前端,它就应该能像开发者一样看到这个前端。这是官方、免费、本地的做法。装上它,指给它你正在做的页面,别再当那个把控制台报错复制到聊天里的人了。